
About the project
This summer I was lucky to be partially involved in the Generation UCL research through the opportunity an Education, Practice and Society Undergraduate Research Fellowship (EPSURF) offered me. At the first meeting, Professor Georgina Brewis, as my supervisor, helped me get to know about the broader project. Generation UCL focuses on exploring 200 years of student life in London while placing students at the centre of UCL’s history. When Georgina first introduced me to Generation UCL, I was deeply attracted to and excited about this project. I mainly had to record data from UCL Annual Reports and Calendars in an Excel spreadsheet, including the number of students and the number of students distributed in various regions for nearly 200 years. In addition, I was also able to plot some trends based on this data. This work was very meaningful because it had never been done before.
Recording the data
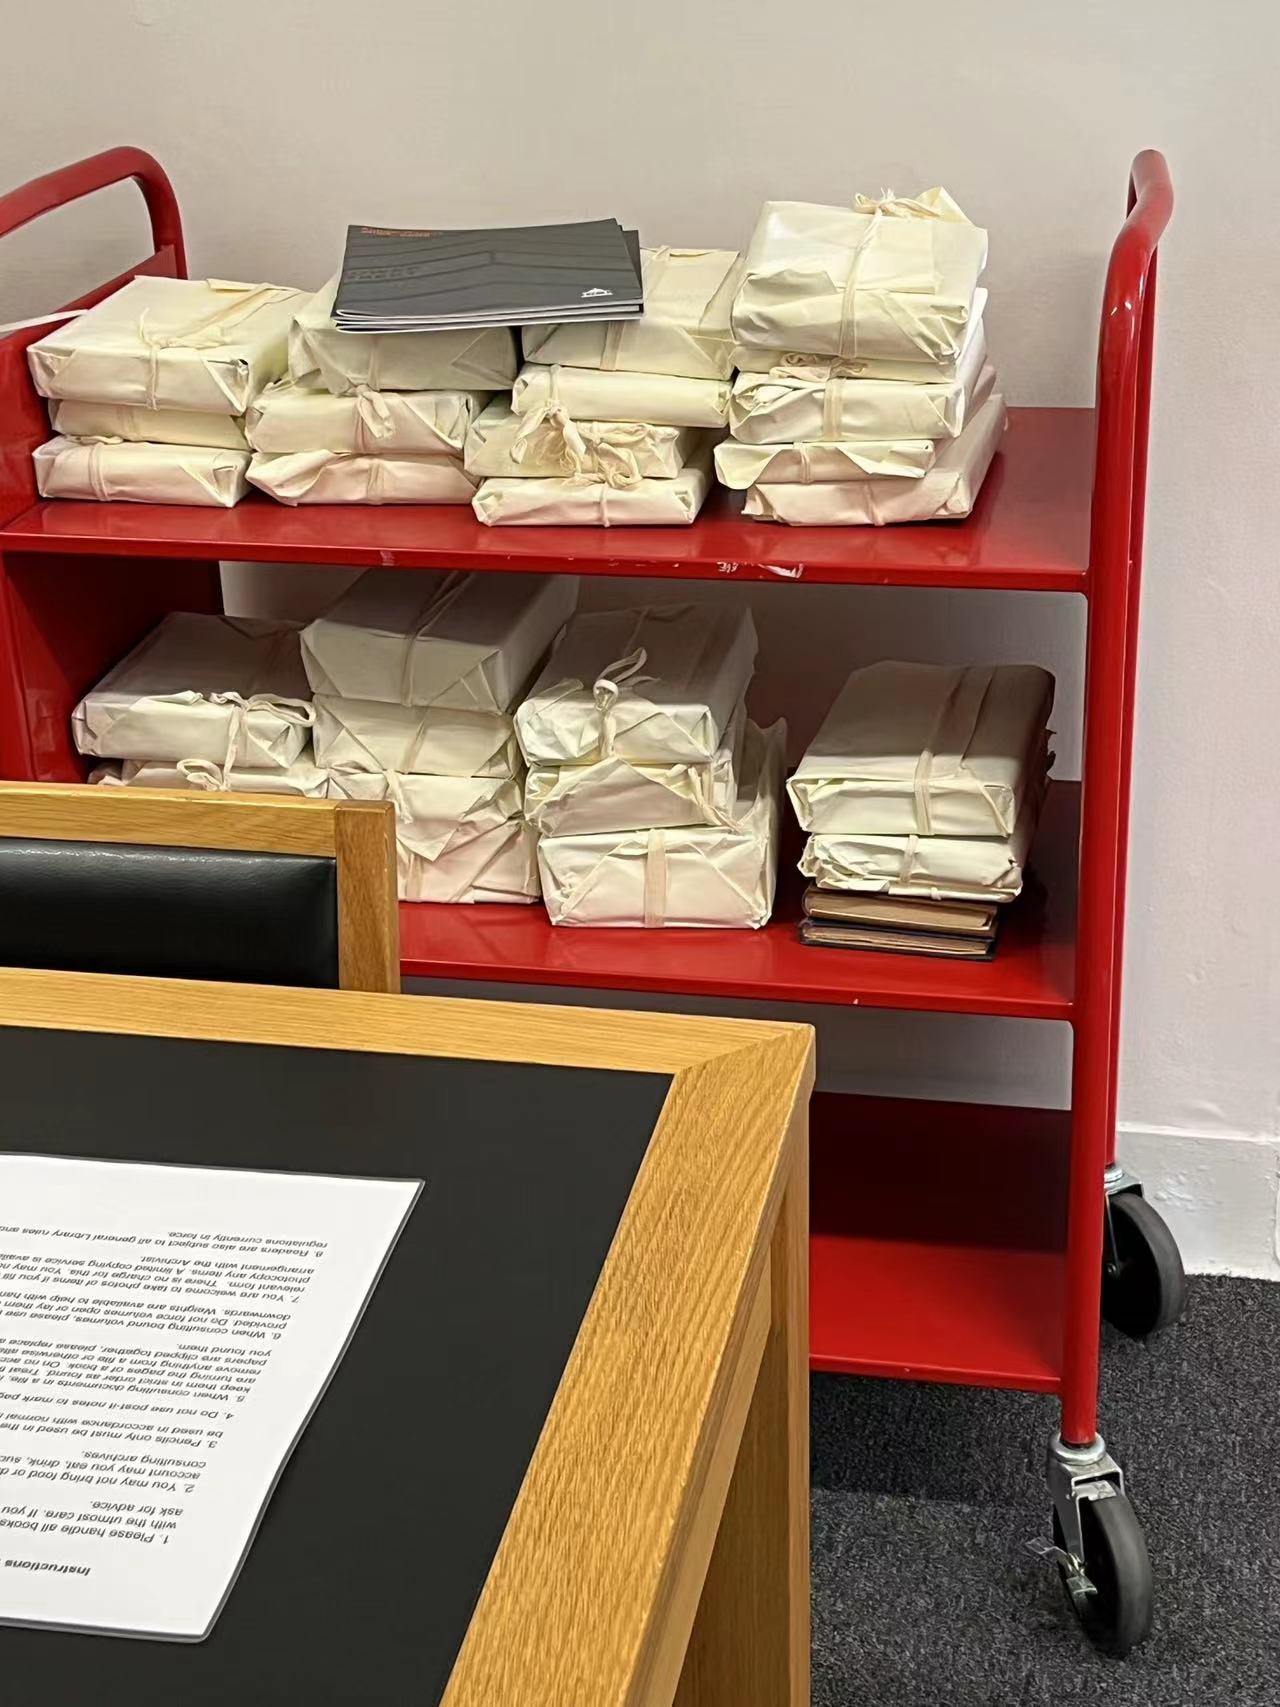
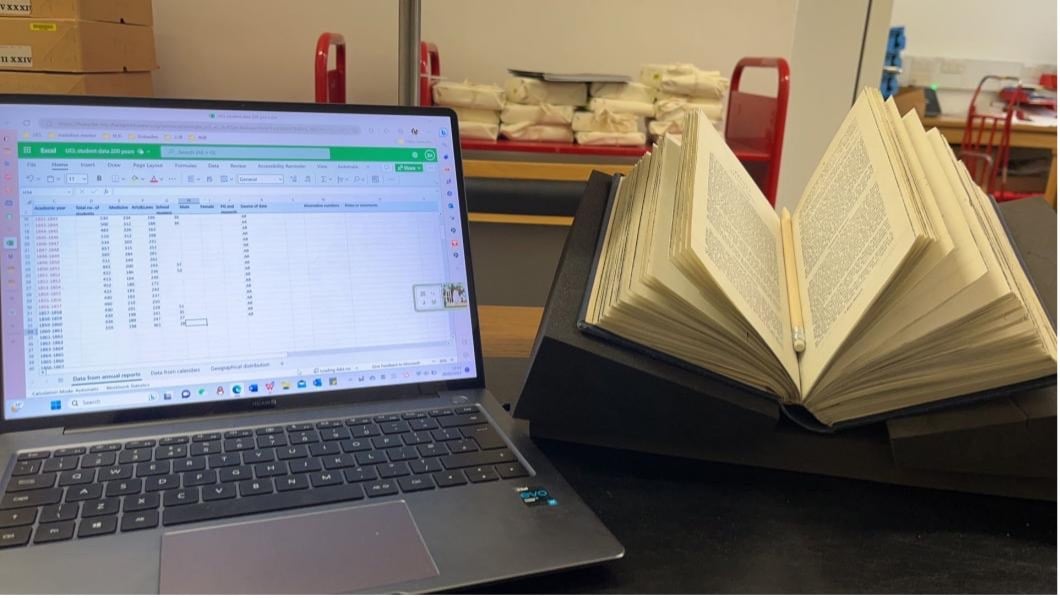
Speaking of data recording, it is important to mention the UCL Special Collections. The South Junction Reading Room is a tiny, unassuming room in UCL's main campus building, but words cannot describe the wonderful feeling I got when I pushed open the door to enter and work! There are no online versions of UCL Annual Reports, so Georgina booked me in to examine them in the UCL Special Collections reading room. I reviewed the paper annual reports for the years 1828-2004. When I first touched and flipped through them, the books were so old and even accompanied by little scraps of paper falling out as I was turning them. I was nervous and shocked. Since then, I treated these old books as carefully as possible, especially when turning the pages. Apart from this, I was also strongly impressed by the people around me who were reading historical materials. I marvelled not just at the wide range of age groups of the visitors, but also at the quiet and attentive atmosphere in which they engaged in the material.
During the process of data recording, several cases of missing data were encountered. For example, data on the number of students were absent for 1939-1940, 1988-2000, and 2004 onwards. For the number of students distributed in different regions, no data was provided in the Annual Reports after 1975. This means that incomplete data is likely to influence overall data trends and analyses. Furthermore, a data discrepancy has been caused because the number of students was noted twice in one annual report but the numbers were not the same. At times the number of students listed for each department did not add up to the total number of students. For instance, from 1863 to 1864, according to the Annual Report, there were 161 students in the medical department and 213 in the arts and laws department, which should add up to a total of 374 students, but the report presented the total number of students as 387. The whole process of recording data is made particularly complex and difficult by these factors. What I did was tag or add notes to these uncertain data so that others could be better aware of the status of the data.
Making the graphs
After I had finished inputting the data of the Annual Reports and Calendars (which are fully digitised online) into the Excel spreadsheet, I tried to make corresponding linear trend graphs based on these data. The first graph is the trajectory of the total number of students from 1828 to 2000 based on Annual Report data, the second is the trajectory of the total number of students from 1852 to 2020based on Calendar data.
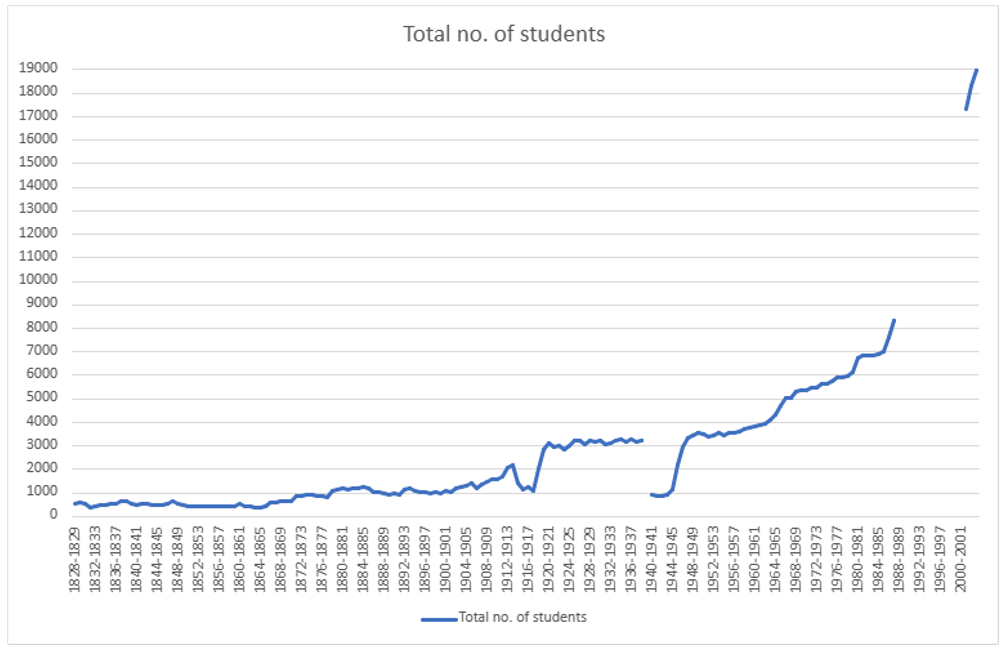

The charts are incomplete due to the loss of some data. As mentioned earlier, an obvious gap appears in the first graph between 1939-1940 and 1988-2000 due to lack of data. Meanwhile, for the second graph, a distinct data gap could also be discovered from 1888 to 1896. The presentation in the line graph could roughly correspond to the underlying data. However, it could be noticed that the two charts have a similar trend as well as an upward direction. Moreover, there could both be observed a significant drop in the total number of students between 1940 and 1944.
In the following meeting, Georgina suggested that I could integrate the two charts into one complete chart, and then showed me some of the significant changes in the data and linked them to historical events for better interpretation. This significant decrease in the total number of students from 1940-1944 was caused by the Second World War (1939–1945). One of the most interesting parts of this work for me is to take flat data and correlate it with historical events to find further connections.
Reflections
Throughout this experience, I had a strong feeling of powerlessness with regard to history or historical materials. Because these materials are very old, it is impossible to verify the data even if I encounter mismatched data. In addition, due to the restricted time I spent with the Special Collections, I was unable to go through each annual report in detail to understand the events that took place at UCL and relate them to the data. The amount of data from these almost 200 years is vast and will need to be further refined and explored by subsequent researchers, which will be remarkable and rewarding.